
Warehouse Metrics Dashboard
Tracking the progress of phases through the shipping process
Shows the rate of phase progressions
Using Spire phases and phase history this dashboard tracks the process from Ready to Pick, through Shipped.
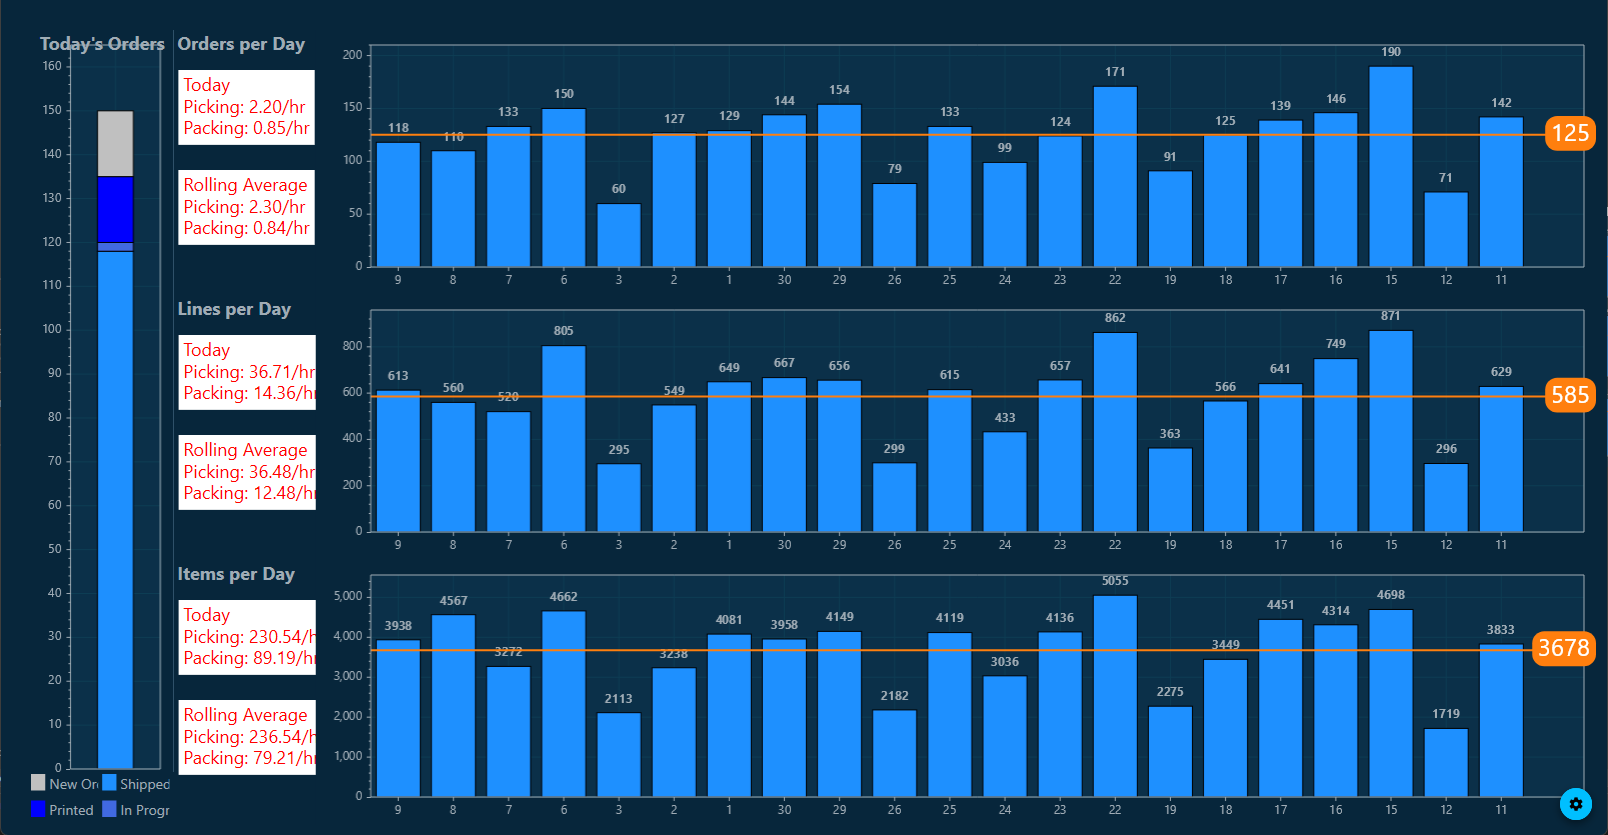
- Graphical Interface: Showing data in easy to read bar graphs, showing 4 week historical data.
- Auto-Refresh: Configurable data refresh rate.